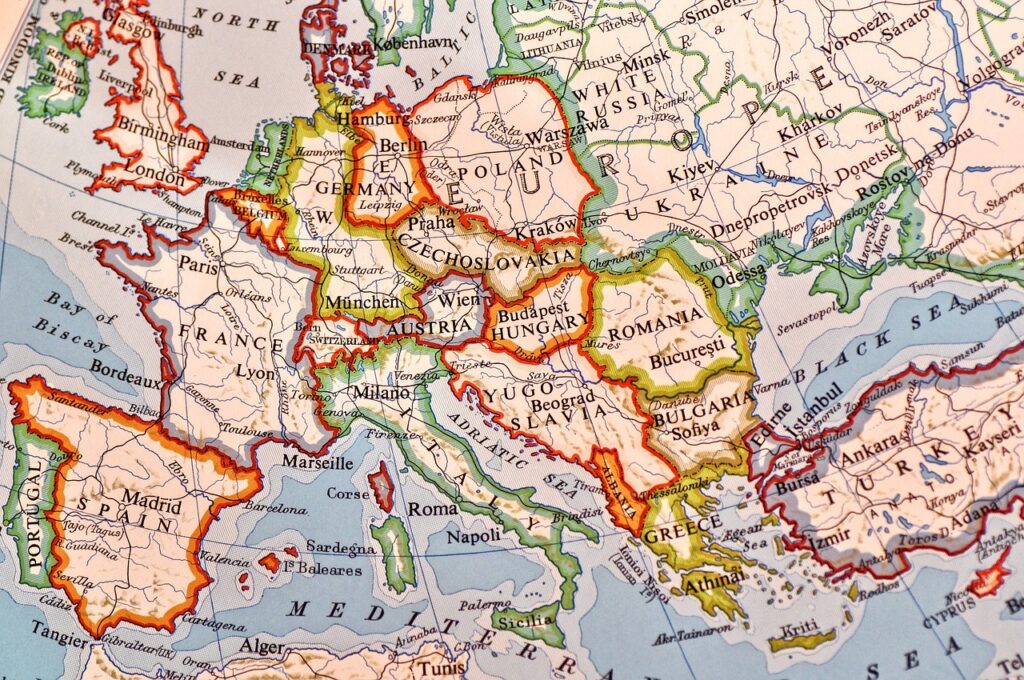
Tableau comes with 6 default map layouts. To take your dashboard design to the next level, customization is key. The good news is you can tailor the map to match your dashboard’s design and color scheme. Tableau has you covered by providing the option to add a URL from Mapbox or WMS. In this blog, you’ll discover the process of creating a free Mapbox account, designing layers, and effortlessly integrating the customized map into Tableau.
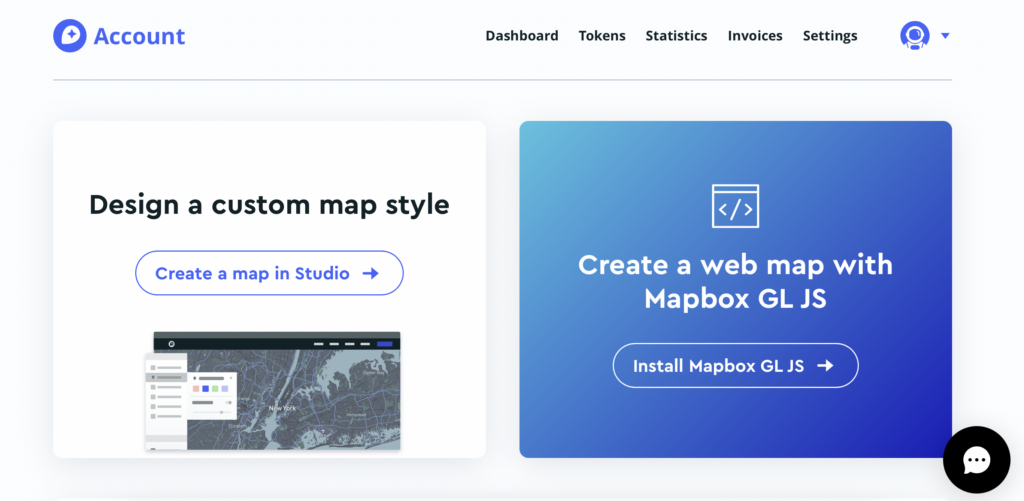
After you have created an account in Mapbox, you will land to a page like the following. Proceed to “Create a map in Studio”
A quick way to kickstart your work is to build on top of an existing map style in the gallery. Simply choose a map from the gallery, click “Add to your studio,” and then customise the colours and edit the layers to suit your liking.
Basic Layers
Mapbox includes some default layer sources. We can search for any available layer under the active sources.
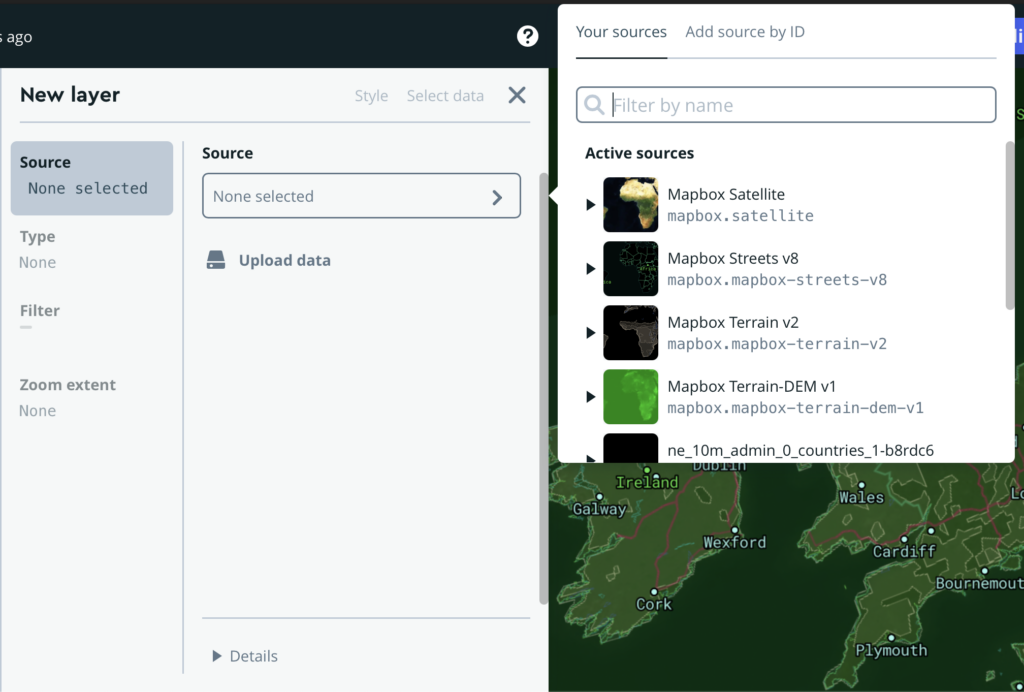
These are the typical basic layers that are frequently used in creating a basic map.
- Background: the background colour of your map
- Satellite: As the name implies, it’s a satellite image of the world. This layer can be omitted if you prefer a street map feel.
- Terrain: Add this layer when we want to highlight mountainous areas
- Water: This layer covers the lakes and the sea of the world.
- Hillshade: This layer allows us to add more sophisticated styling to the mountain range
Adding Layers from external source
There are 7 file formats supported by the Mapbox upload. This means that we can add other shapefile, KML, GPX, etc. as a layer to mapbox. Natural Earth provides excellent free map resources that can be uploaded to Mapbox and styled according to our needs. If we obtain a shapefile containing all countries in the world, we can then, for instance, isolate a specific country. Once the file has been successfully loaded to Mapbox, you can find it under “Unused sources”.

Style with data conditions
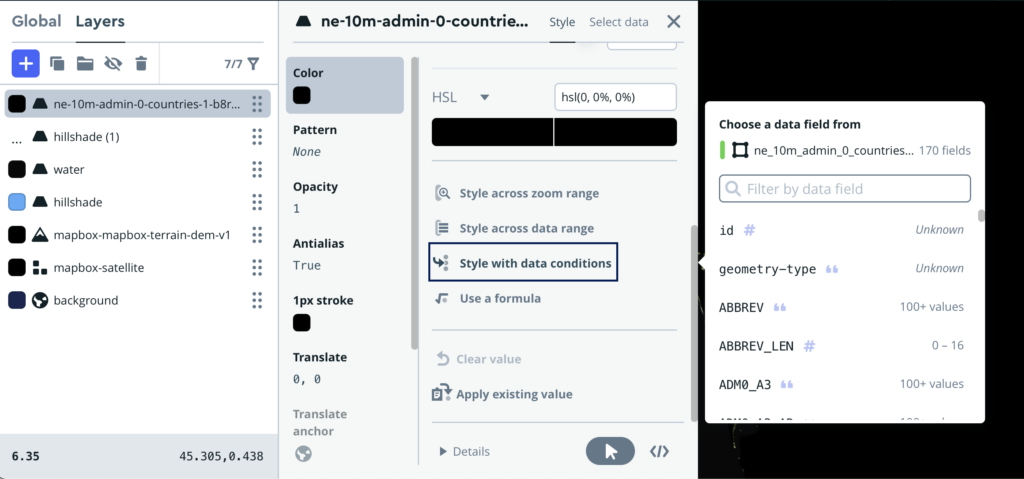
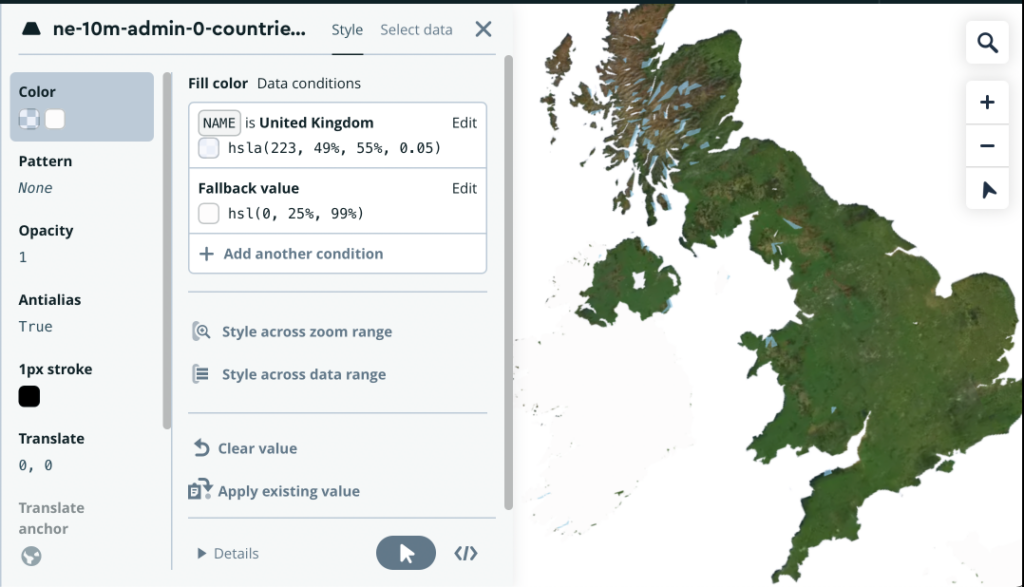
By default, the imported layer will be colored black. To achieve more sophisticated styling, we can customize the appearance of this layer based on conditions we define for specific data points. In this case, we will single out the United Kingdom using “Style with data conditions.” After that, we can modify its color and the fallback color to achieve the contrast we need.
Style across data range
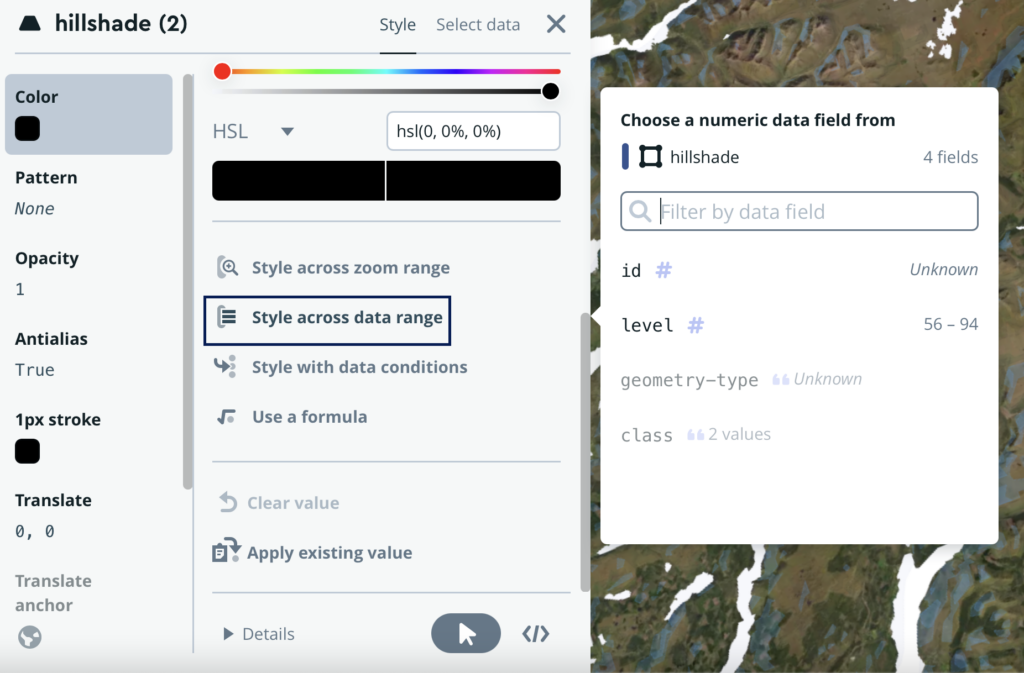
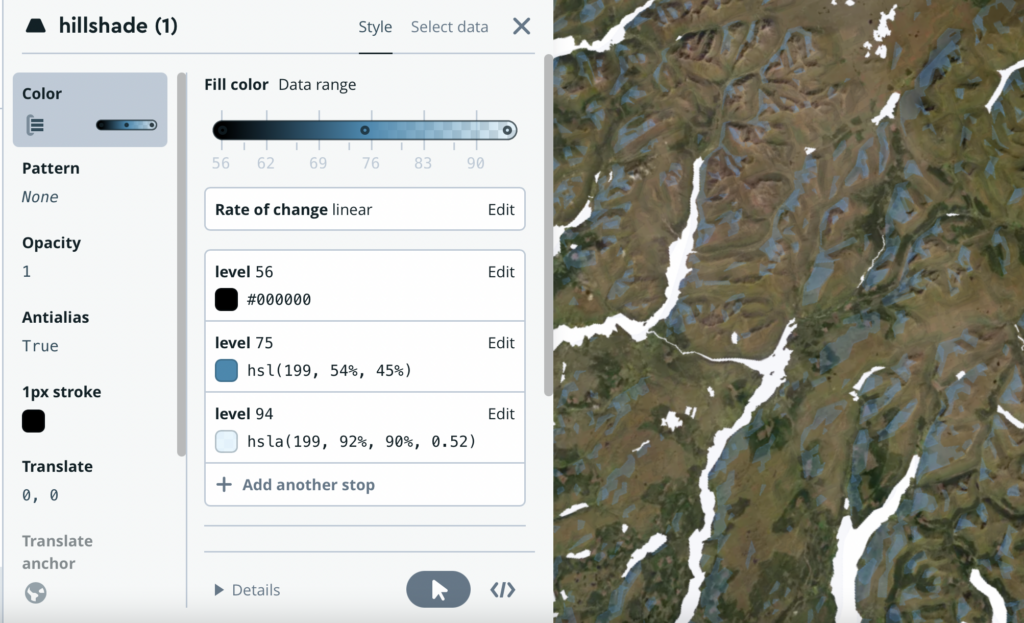
We can also apply styling to the numeric data field of the spatial file layer using “Style across data range.” The colour change for the value range can be configured by “adding another stop”.
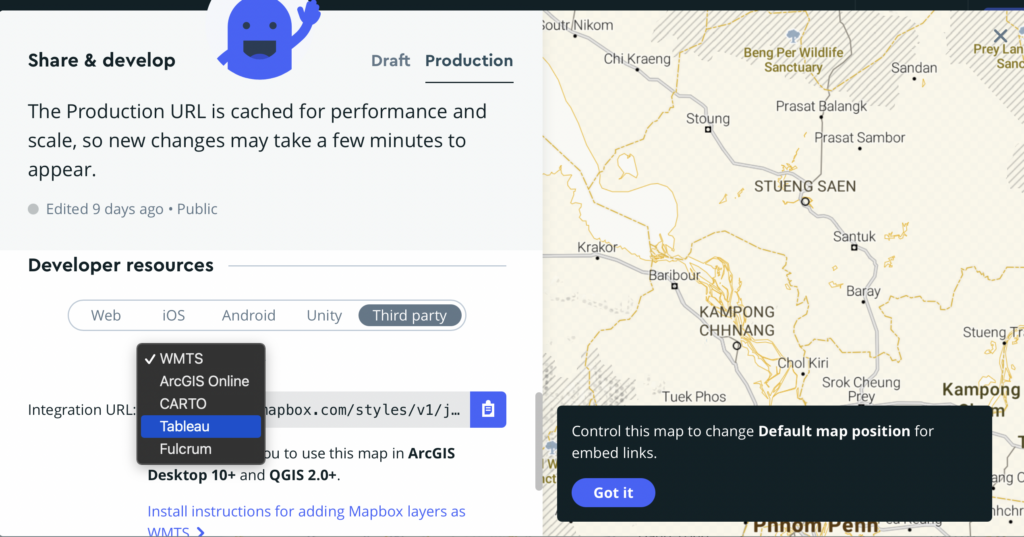
After you are done styling in Mapbox, publish and make it available to public. Click “Share,” select “Third party,” then check “Tableau,” and copy-paste the URL into Tableau.
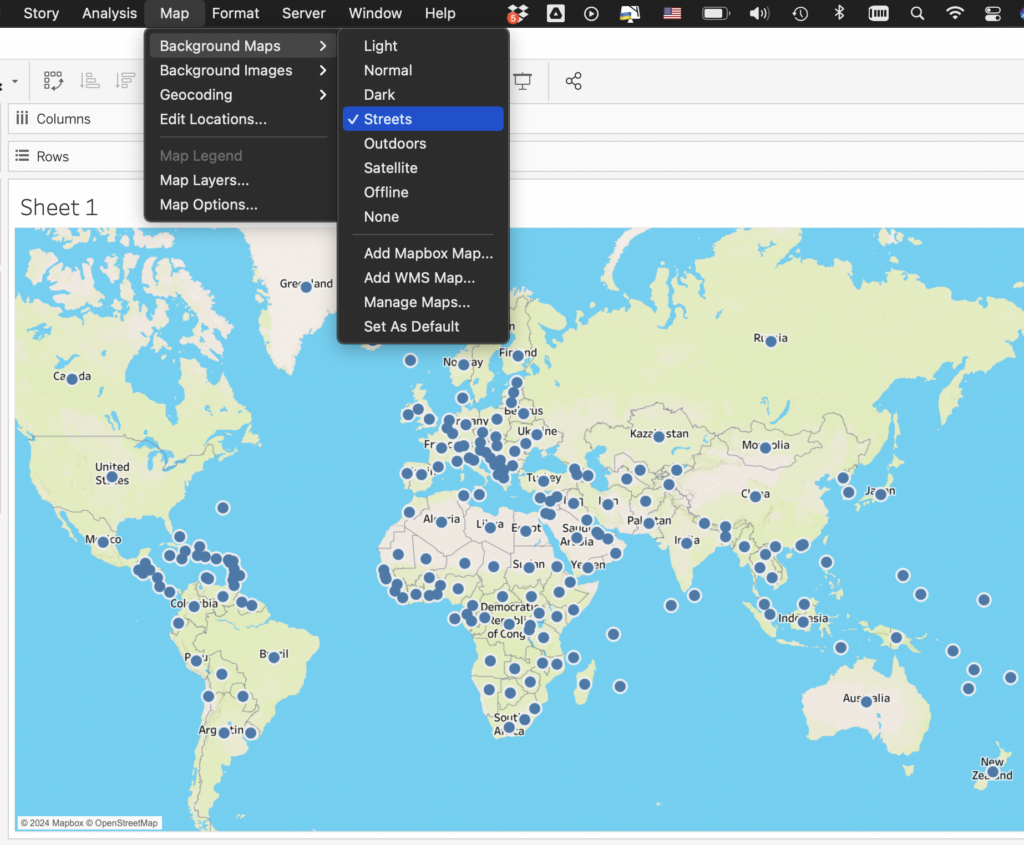
In Tableau, go to Map > Background Maps and then “Add Mapbox Map”, paste the URL in the pop up window. The Tableau map background will then change to the Mapbox-styled map you just created.

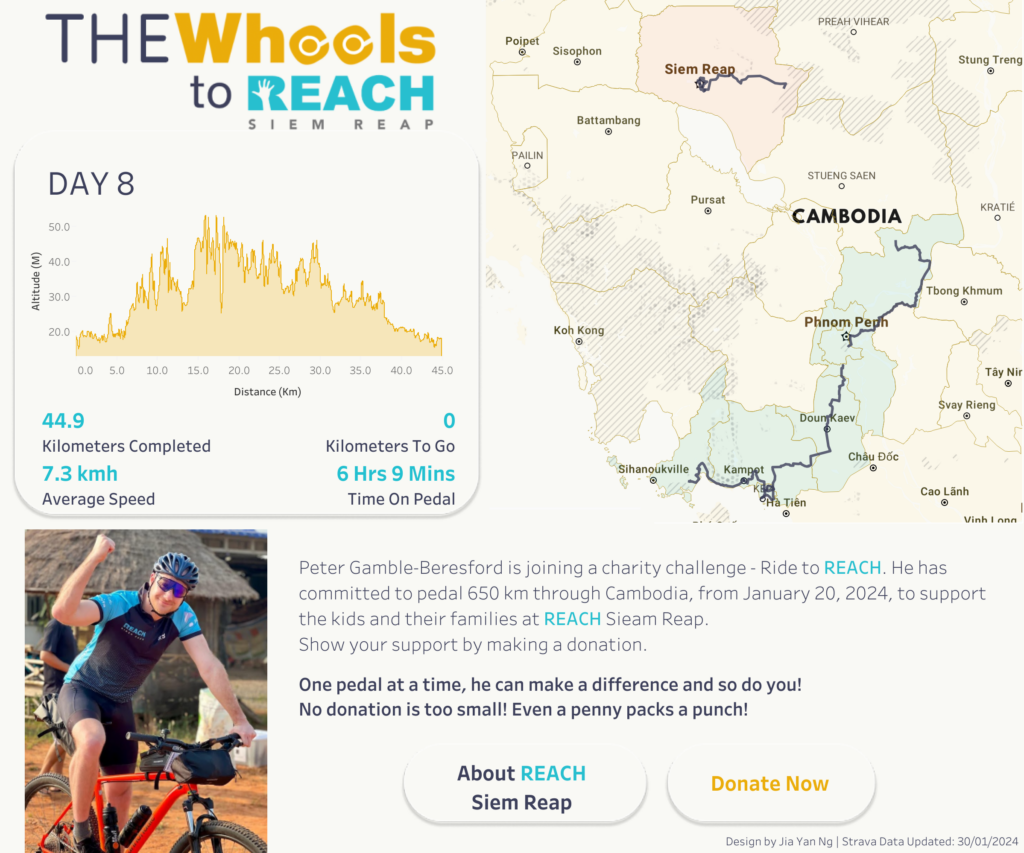
I’ve applied the Mapbox styling technique mentioned in this dashboard created for fundraising in Cambodia. Feel free to check it out by clicking the image below, which is linked to my Tableau Public account.
